![By Tdadamemd [CC BY-SA 4.0 (http://creativecommons.org/licenses/by-sa/4.0)], via Wikimedia Commons](https://cs193p.m2m.at/wp-content/uploads/2015/03/cs193p-Project-3-Assignment-3-Extra-Task-5-825x510.jpg)
Please note, this blog entry is from a previous course. You might want to check out the current one.
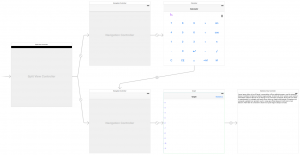
Add a popover to your new MVC that reports the minimum and maximum y-value (and other stats if you wish) in the region of the graph currently being shown. This will require you to create yet another new MVC and segue to it using a popover segue. It will also require some new public API in your generic graph view to report stats about the region of the graph it has drawn.
Add a new view controller (and a new class for it) and connect it to a new bar button item of the graph-view controller. Make the segue present the new view controller as popover and give it a sensible identifier. Add a text view including some constraints (Reset to suggested constraints should work fine).
Link the text view to the new view controller and set it’s text using a public text property.
    @IBOutlet weak var textView: UITextView! {
        didSet {
            textView.text = text
        }
    }

    var text: String = "" {
        didSet {
            textView?.text = text
        }
    }
To auto shrink the popover to the text provide the size (if available) to the controller:
    override var preferredContentSize: CGSize {
        get {
            if textView != nil && presentingViewController != nil {
                return textView.sizeThatFits(presentingViewController!.view.bounds.size)
            }
            return super.preferredContentSize
        }
        set { super.preferredContentSize = newValue }
    }
The graph view controller needs to be a delegate for the popover controller:
class GraphViewController: ..., UIPopoverPresentationControllerDelegate
… and set to be its delegate when preparing for the segue:
    private struct Keys {
        ...
        static let SegueIdentifier = "Show Statistics"
    }
    override func prepareForSegue(segue: UIStoryboardSegue, sender: AnyObject?) {
        if let identifer = segue.identifier {
            switch identifer {
            case Keys.SegueIdentifier:
                if let tvc = segue.destinationViewController as? StatisticsViewController {
                    if let ppc = tvc.popoverPresentationController {
                        ppc.delegate = self
                    }
                    // provide data to the popover
                }
            default: break
            }
        }
    }
… and the delegate gets a single method to enable the popover presentation:
    func adaptivePresentationStyleForPresentationController(controller: UIPresentationController) -> UIModalPresentationStyle {
        return UIModalPresentationStyle.None
    }
Up to know the code does not differ to much from the Psychologist code of the lecture.
To store the statistics we use a dictionary where the key is the statistics name.
private var statistics = [String: Double]()
We will calculate the statistics when the data-source delegate of the graph view gets called. But the delegate method does not really know, if the current value is the first or the last value, or even if the graph view wants to redraw in which case our statistics should reset.
Such redraws happen when the view gets initialized and during/after gestures. That’s when we are resetting our statistics:
    @IBOutlet weak var graphView: GraphView! {
        didSet {
            ...
            resetStatistics()
            ...
    }

    func zoom(gesture: UIPinchGestureRecognizer) {
        ...
            resetStatistics()
            ...
    }

    func move(gesture: UIPanGestureRecognizer) {
        ...
            resetStatistics()
            ...
    }

    func center(gesture: UITapGestureRecognizer) {
        ...
            resetStatistics()
            ...
    }

    private func resetStatistics() {
        statistics["min"] = nil
        statistics["max"] = nil
        statistics["avg"] = nil
    }
As mentioned before the calculation of the statistics happen in the data-source-delegate method:
    func y(x: CGFloat) -> CGFloat? {
        ...
            if let minValue = statistics["min"] {
                statistics["min"] = min(minValue, y)
            } else {
                statistics["min"] = y
            }
            if let maxValue = statistics["max"] {
                statistics["max"] = max(maxValue, y)
            } else {
                statistics["max"] = y
            }
            if let avgValue = statistics["avg"] {
                statistics["avg"] = statistics["avg"]! + y
                statistics["avgNum"] = statistics["avgNum"]! + 1
            } else {
                statistics["avg"] = y
                statistics["avgNum"] = 1
            }
            ...
    }
When preparing the segue we need to clean up the statistics (e.g. for the average). Then we create an array of strings of the individual statistics and connect them separated by a “new line”:
    override func prepareForSegue(segue: UIStoryboardSegue, sender: AnyObject?) {
                    ...
                    finishStatistics()
                    var texts = [String]()
                    for (key, value) in statistics {
                        texts += ["\(key) = \(value)"]
                    }
                    tvc.text = texts.count > 0 ? "\n".join(texts) : "none"
                ...
    }
To calculate the average we just added all values and took count of the number of values. So we divide on through the other and reset the counter:
    private func finishStatistics() {
        if let num = statistics["avgNum"] {
            if let avgValue = statistics["avg"] {
                statistics["avg"] = avgValue / num
                statistics["avgNum"] = nil
            }
        }
    }
One final tiny adjustment: Above we missed one case when the graph gets redrawn – when the device is rotated:
    override func viewWillLayoutSubviews() {
        super.viewWillLayoutSubviews()
        resetStatistics()
    }
The complete code for the extra task #5 is available on GitHub.