cs193p – Calculator Update Swift 1.2

Please note, this blog entry is from a previous course. You might want to check out the current one.

To run the calculator code with Swift 1.2. tiny adjustments are necessary:

  • countElements() is now called count()
  • as needs to be replaced with as!

… and I forgot to address the second operator in assignment #2 extra task #1.

The updated code is available on GitHub.

FacebooktwitterredditpinterestlinkedintumblrmailFacebooktwitterredditpinterestlinkedintumblrmail

cs193p – Project #3 Assignment #3 Extra Task #6

Please note, this blog entry is from a previous course. You might want to check out the current one.

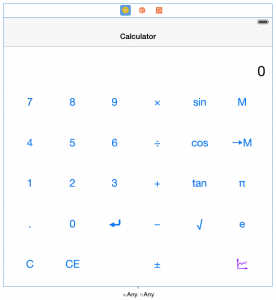
Have your Calculator react to size class changes by laying out the user-interface differently in different size class environments (i.e. buttons in a different grid layout or even add more operations in one arrangement or the other). Doing this must not break anything else!

Most likely for the first step it is best to remove all constraints. Add some new buttons (I added a tangens operation, the euler constant and two blank buttons). Arrange them into an additional column. Have fun adding back the constraints (which does not really differ from the previous assignments …)

cs193p - Project #3 Assignment #3 Extra Task #6 - Any-Any Layout
cs193p – Project #3 Assignment #3 Extra Task #6 – Any-Any Layout

Continue reading “cs193p – Project #3 Assignment #3 Extra Task #6”

FacebooktwitterredditpinterestlinkedintumblrmailFacebooktwitterredditpinterestlinkedintumblrmail

cs193p – Project #3 Assignment #3 Extra Task #5

Please note, this blog entry is from a previous course. You might want to check out the current one.

Add a popover to your new MVC that reports the minimum and maximum y-value (and other stats if you wish) in the region of the graph currently being shown. This will require you to create yet another new MVC and segue to it using a popover segue. It will also require some new public API in your generic graph view to report stats about the region of the graph it has drawn.

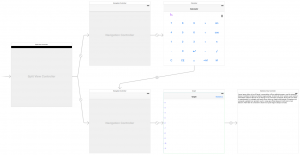
Add a new view controller (and a new class for it) and connect it to a new bar button item of the graph-view controller. Make the segue present the new view controller as popover and give it a sensible identifier. Add a text view including some constraints (Reset to suggested constraints should work fine).
cs193p - Project #3 Assignment #3 Extra Task #5 - Popover View Controller
Continue reading “cs193p – Project #3 Assignment #3 Extra Task #5”

FacebooktwitterredditpinterestlinkedintumblrmailFacebooktwitterredditpinterestlinkedintumblrmail

cs193p – Project #3 Assignment #3 Extra Task #4

Please note, this blog entry is from a previous course. You might want to check out the current one.

Upon rotation (or any bounds change), maintain the origin of your graph with respect to the center of your graphing view rather than with respect to the upper left corner.

The easy way would be to define the origin not relative to the left top corner, but to the center … But then our API would be different to the axis drawer, and if somebody already would have been using our API we would break their code …
Continue reading “cs193p – Project #3 Assignment #3 Extra Task #4”

FacebooktwitterredditpinterestlinkedintumblrmailFacebooktwitterredditpinterestlinkedintumblrmail

cs193p – Project #3 Assignment #3 Extra Task #3

Please note, this blog entry is from a previous course. You might want to check out the current one.

Preserve origin and scale between launchings of the application. Where should this be done to best respect MVC, do you think?

The easy way would be in the graph view, but that would not respect MVC … Let’s put it in the graph view controller. The only problem is how to know when the origin and scale of the graph view have changed. While can set them easily because they are public variables, we currently have observation mechanism outside the graph-view class. We could add delegation methods to its data-source protocol or better create a delegation protocol …
Continue reading “cs193p – Project #3 Assignment #3 Extra Task #3”

FacebooktwitterredditpinterestlinkedintumblrmailFacebooktwitterredditpinterestlinkedintumblrmail

cs193p – Project #3 Assignment #3 Extra Task #2

Please note, this blog entry is from a previous course. You might want to check out the current one.

Use the information you found above to improve panning performance. Do NOT turn your code into a mess to do this. Your solution should be simple and elegant. There is a strong temptation when optimizing to sacrifice readability or to violate MVC boundaries, but you are NOT allowed to do that for this Extra Credit!

… not drawing the axis would not really help that much. Drawing using lower resolution would not really look that nice. Caching data would violate our MVC boundaries, even if that’s debatable …

Let’s go for the last solution, we create a snapshot of the current graph:

    var snapshot:UIView?

Continue reading “cs193p – Project #3 Assignment #3 Extra Task #2”

FacebooktwitterredditpinterestlinkedintumblrmailFacebooktwitterredditpinterestlinkedintumblrmail

cs193p – Project #3 Assignment #3 Extra Task #1

Please note, this blog entry is from a previous course. You might want to check out the current one.

Figure out how to use Instruments to analyze the performance of panning and pinching in your graphing view. What makes dragging the graph around so sluggish? Explain in comments in your code what you found and what you might do about it.

Instead of running the app profile ⌘I it and choose the time profiler. Press the record button, create a graph in the app and start panning and pinching, and finally stop the profiler.
Continue reading “cs193p – Project #3 Assignment #3 Extra Task #1”

FacebooktwitterredditpinterestlinkedintumblrmailFacebooktwitterredditpinterestlinkedintumblrmail