![von Hmaag (Eigenes Werk) [CC BY-SA 3.0 (http://creativecommons.org/licenses/by-sa/3.0) oder GFDL (http://www.gnu.org/copyleft/fdl.html)], via Wikimedia Commons](https://cs193p.m2m.at/wp-content/uploads/2015/03/cs193p-Project-3-Assignment-3-Extra-Task-1-825x510.jpg)
Please note, this blog entry is from a previous course. You might want to check out the current one.
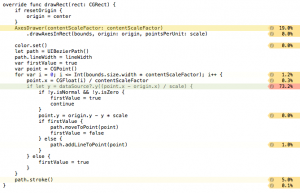
Figure out how to use Instruments to analyze the performance of panning and pinching in your graphing view. What makes dragging the graph around so sluggish? Explain in comments in your code what you found and what you might do about it.
Instead of running the app profile ⌘I it and choose the time profiler. Press the record button, create a graph in the app and start panning and pinching, and finally stop the profiler.
Hide the system libraries and you will see that drawRect of the graph view takes most of the time. Double click on the method name and you will see that the axis drawer takes nearly twenty and the actual calculation more than seventy per cent of the time.
… some ideas about what to do:
- We could just skip drawing the axis while panning …
- We could reduce the resolution of the graph by calculating only every 10th point …
- We could cache the calculation results and use them while panning …
- We could – like the iOS does when rotating the layout – save an image of the view before the gesture and manipulate its size and position instead of recalculating the graph …