Please note, this blog entry is from a previous course. You might want to check out the current one.
Add a popover to your new MVC that reports the minimum and maximum y-value (and other stats if you wish) in the region of the graph currently being shown. This will require you to create yet another new MVC and segue to it using a popover segue. It will also require some new public API in your generic graph view to report stats about the region of the graph it has drawn.
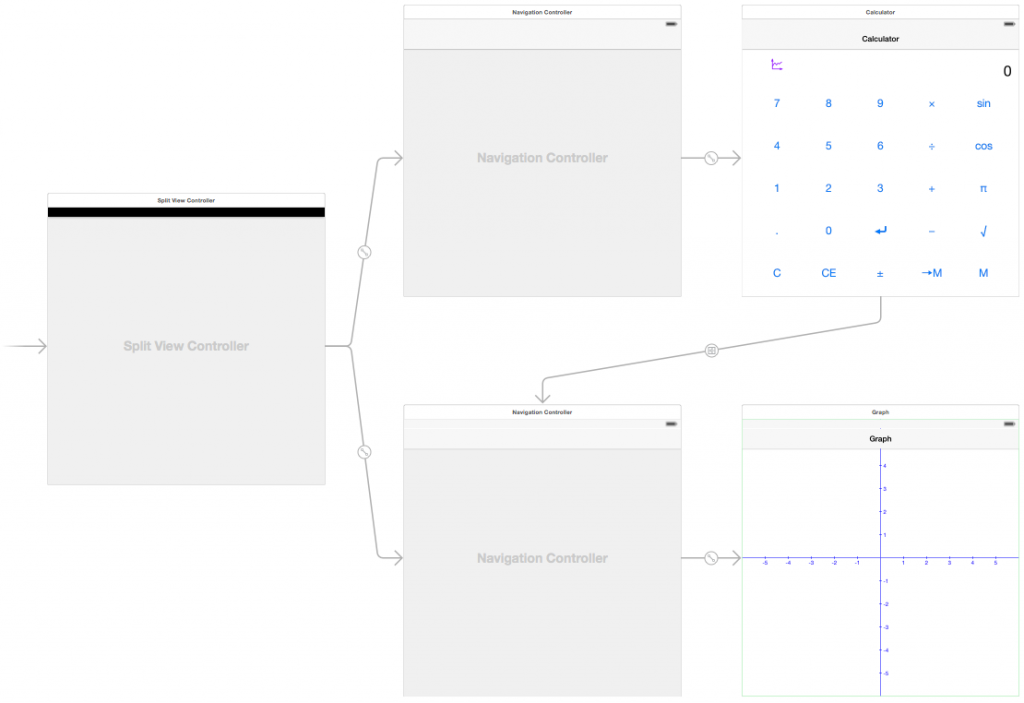
Add a new view controller (and a new class for it) and connect it to a new bar button item of the graph-view controller. Make the segue present the new view controller as popover and give it a sensible identifier. Add a text view including some constraints (Reset to suggested constraints should work fine).

Continue reading “cs193p – Project #3 Assignment #3 Extra Task #5”


